Financial Disclosure
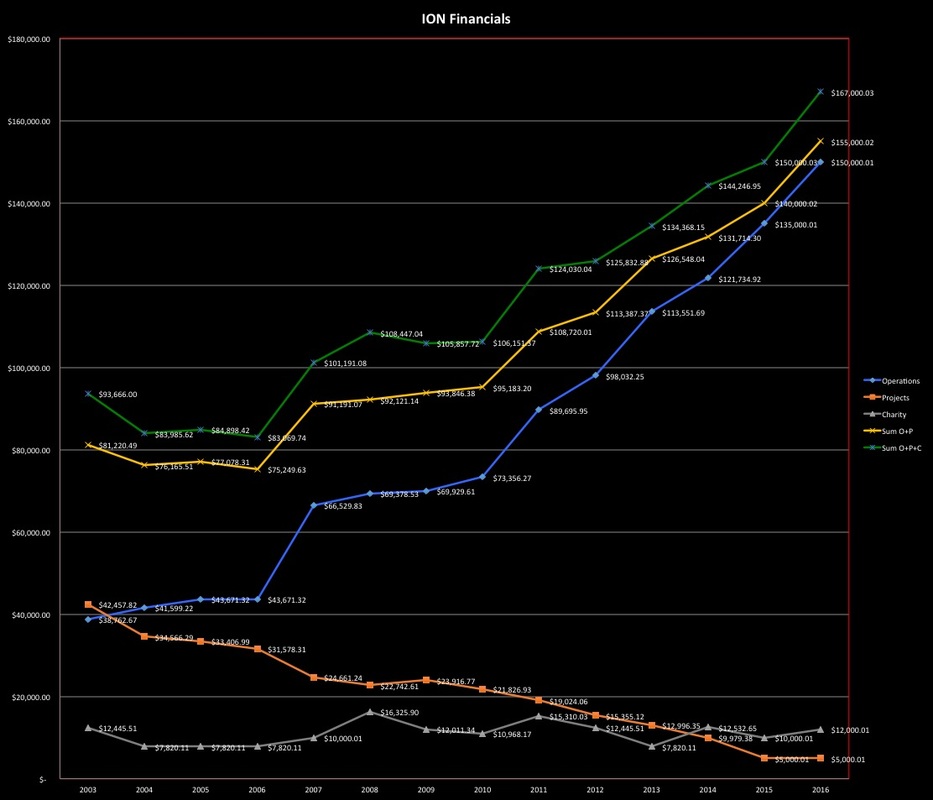
Steadily increasing compensation for embedded consultancy is one of several measures of success. Financial disclosures are relevant to future projects and negotiations involving operational roles. The data chart below tracks financial trends from 2003 through 2015. Noteworthy is the trending for vendor roles, represented as projects, versus embedded roles, represented as operations. The steady increase in billing for operations is a reflection of fluency within administration in executive liaison, performance improvement, and change management capacities. Calculations beyond the near 100% cumulative increase below are not represented on the chart, but may be requested.
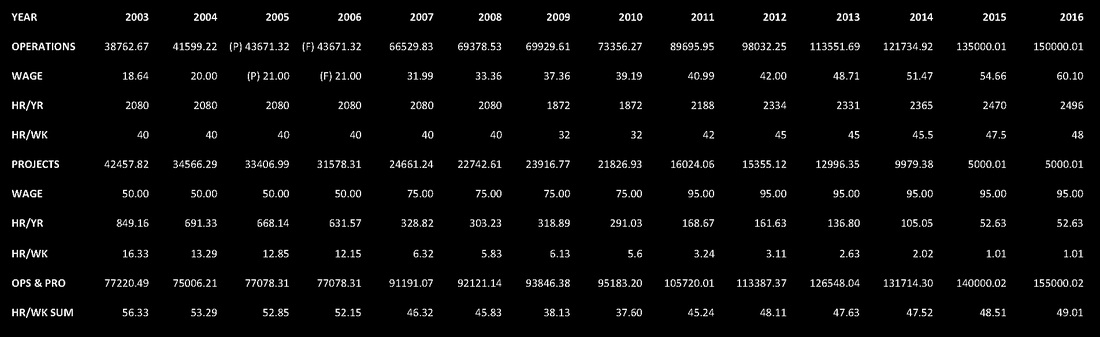
The following data table is specific to operational roles following 2007 through 2015:
The following data table is specific to operational roles following 2007 through 2015:
|
Year
2015 2014 2013 2012 2011 2010 2009 2008 2007 |
Inflation
+ 0.1% + 1.6% + 1.5% + 2.1% + 3.2% + 1.6% - 0.4% + 3.8% + 2.8% |
Annual
+ 14.5% + 7.2% + 15.8% + 9.3% + 22.3% + 4.9% + 0.8% Baseline - / + |
Cumulative
+ 99.3% + 75.5% + 63.7% + 41.3% + 29.3% + 5.7% + 0.8% Baseline - / + |
Operations
$139,383.09 $121,734.92 $113,551.69 $98,032.25 $89,695.95 $73,356.27 $69,929.61 $69,378.53 $66,529.83 |
Data Set